HIV data set
In the COPHAR II-ANRS 134 trial, an open prospective non-randomized interventional study, 115 HIV-infected patients adults started an antiviral therapy. 48 patients were treated with indinavir (and ritonavir as a booster) (treatment A), 38 with lopinavir (and ritonavir as a booster) (treatment B), and 35 with nelfinavir (Treatment C). patients were followed one year after treatment initialization.
Viral load and CD4 cell count were measured at screenin, at inclusion and at weeks 2 (or 4), 8, 16, 24, 36, and 48. Plasma HIV-1-RNA were measured by Roche monitored with a limit of quantification of 50 copies/ml. The results of this trial are reported in Duval and al. (2009). The simulated data set is in Datxplore demos.
On the two following figures, one could see the two outputs with respect to time for all subjects split by treatments. The red circle corresponds to censored data.
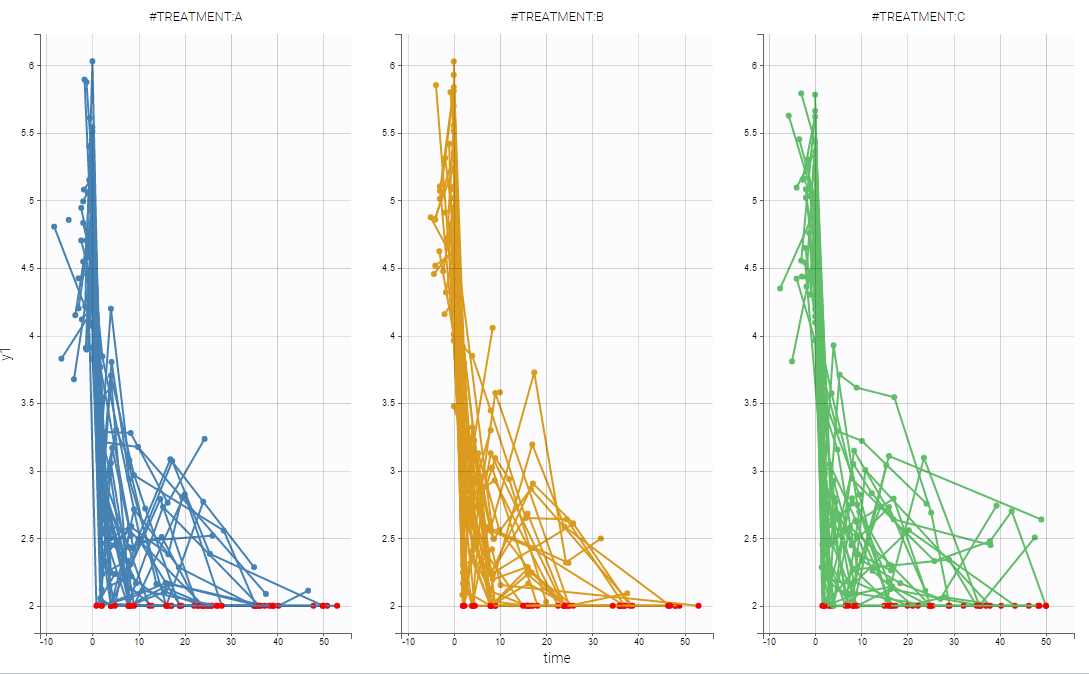

Notice, that these figures were generated using Datxplore.
Simplified HIV data set
The data set for subject 2 can be defined as follows
ID TIME    Y_NCENS Y   CENS    YTYPE   TREATMENT
2   -2.43   4.9443  4.9443  0   1    A
2   -2.43   249 249 0   2    A
2   0   4.5245  4.5245  0   1    A
2   2   2.3546  2.3546  0   1    A
2   2   266 266 0   2    A
2   4.29    268 268 0   2    A
2   8   2.5585  2.5585  0   1    A
2   8   34  34  0   2    A
2   16  352 352 0   2    A
2   24  1.7981  2   1   1    A
2   24  385 385 0   2    A
2   32  348 348 0   2    A
2   43  415 415 0   2    A
Interpretation
One can see the following columns
- ID: the subject ID, column-type ID.
- TIME: the time of the measurement, column-type TIME.
- Y_NCENS: Non censored measurement. Ignored in the representation.
- Y: Considered measurement taking the censoring constraints into account, column-type OBSERVATION.
- CENS: Explicit if the data is censored or not, and the associated type of censoring, column-type CENSORING.
- YTYPE: the type of measurement. In this study, one has two measurements, column-type OBSERVATION ID.
- TREATMENT: Type of treatment, considered as a categorical covariate in our case, column-type CATEGORICAL COVARIATE.
Several points can be noticed.
- There are no dose in the data set.
- There is only a categorical covariate defining the treatment.
- In the presented case, one does not necessary have both measurements at the same time. Indeed, this is not required for data export using Datxplore, nor parameter estimation using Monolix. Moreover, measurements for negative time is possible.