Warfarin data set
This data set has been originally published in:
Warfarin is an anticoagulant normally used in the prevention of thrombosis and thromboembolism, the formation of blood clots in the blood vessels and their migration elsewhere in the body, respectively. The data set provides set of plasma warfarin concentrations and Prothrombin Complex Response in thirty normal subjects after a single loading dose. A single large loading dose of warfarin sodium, 1.5 mg/kg of body weight, was administered orally to all subjects. Measurements were made each 12 or 24h.
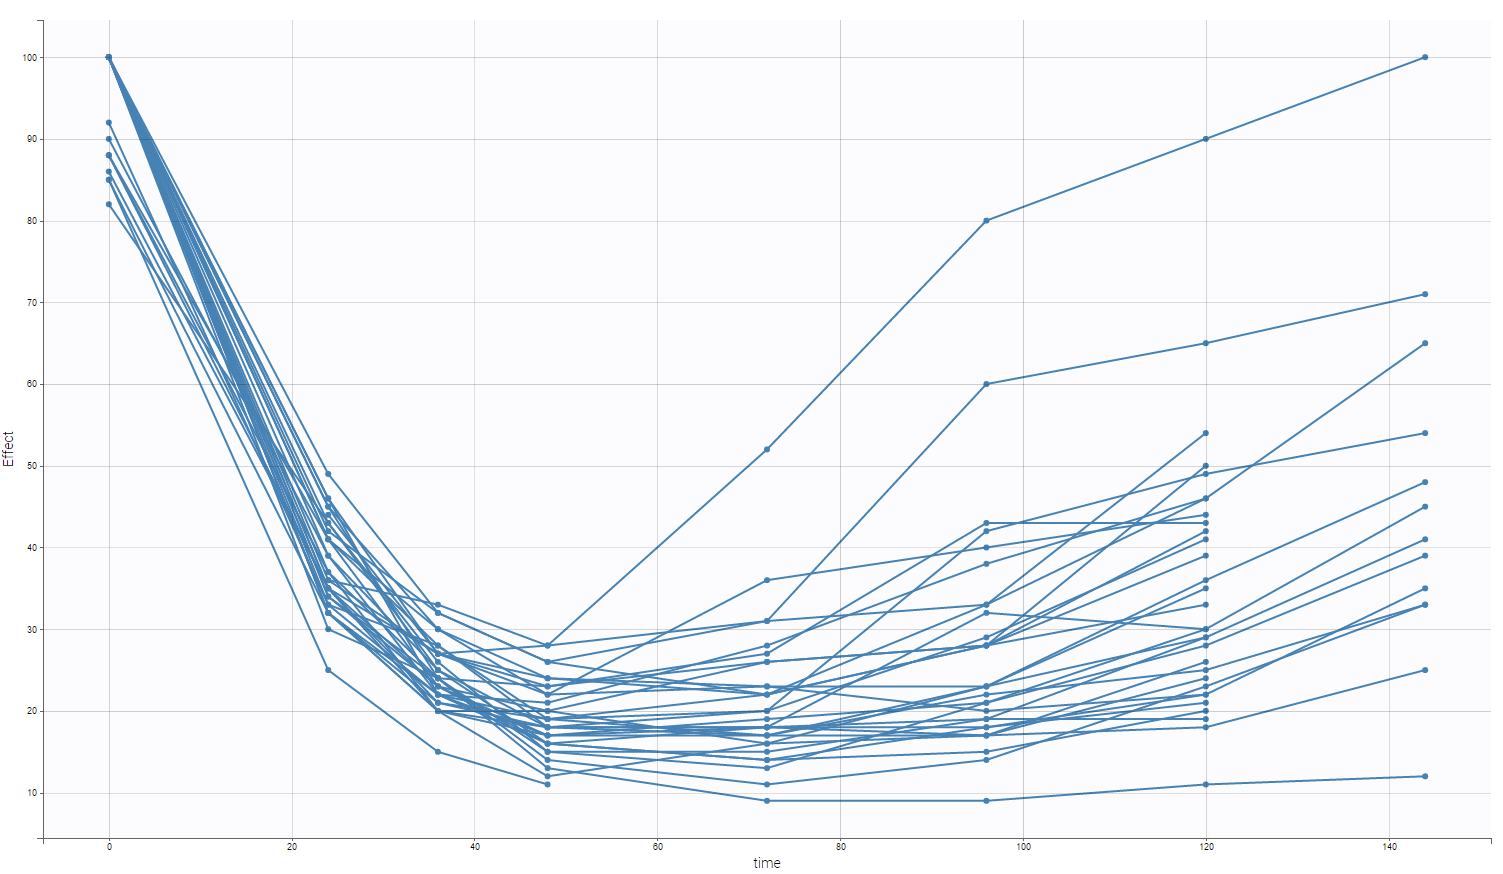
On the two following figure, one could see the concentration and the effect with respect to time for all subjects.

The data set for subject one can be defined as follows
id time    amt dv  dvid    wt  age sex
1   0   100 .   1   66.7    50  1
1   0   .   100 2   66.7    50  1
1   24  .   9.2 1   66.7    50  1
1   24  .   49  2   66.7    50  1
1   36  .   8.5 1   66.7    50  1
1   36  .   32  2   66.7    50  1
1   48  .   6.4 1   66.7    50  1
1   48  .   26  2   66.7    50  1
1   72  .   4.8 1   66.7    50  1
1   72  .   22  2   66.7    50  1
1   96  .   3.1 1   66.7    50  1
1   96  .   28  2   66.7    50  1
1   120 .   2.5 1   66.7    50  1
1   120 .   33  2   66.7    50  1
Interpretation
One can see the following columns
- id: the subject ID, column-type ID
- time: the time of the measurement or of the dose, column-type TIME.
- amt: the amount of drug provided to this subject, column-type AMOUNT.
- dv: the measurement, column-type OBSERVATION.
- dvid: the type of measurement. In this study, one has two measurement, the concentration measurement (corresponding to the PK dynamics), and the Prothrombin Complex Response (corresponding to the PD-part), column-type OBSERVATION ID.
- wt: Weight of the subject, column-type CONTINUOUS COVARIATE.
- age: Age of the subject, column-type CONTINUOUS COVARIATE.
- sex: Sex of the subject, column-type CATEGORICAL COVARIATE.
Several points can be noticed.
- The first line corresponds to a dose, while the other ones are measurements. This explains the dot in the CONC column for the first line and the dots in the AMT column for the other ones.
- The covariates columns (the continuous wt and the categorical covariates age and sex) are filled with the same values. Even though it is not necessary, we encourage the user to fill the columns for readability and usage reasons.
- In the presented case, both PK and PD measurements are at the same time, this is not required for data exploration using Datxplore, nor parameter estimation using Monolix.
- Finally, notice that no initial washout is needed at the beginning as by default, the null initial condition is used for parameter estimation.
Interestingly, one can display the Effect with respect to the Concentration in order to have an idea on how to model the interaction between the PD and the PK part.
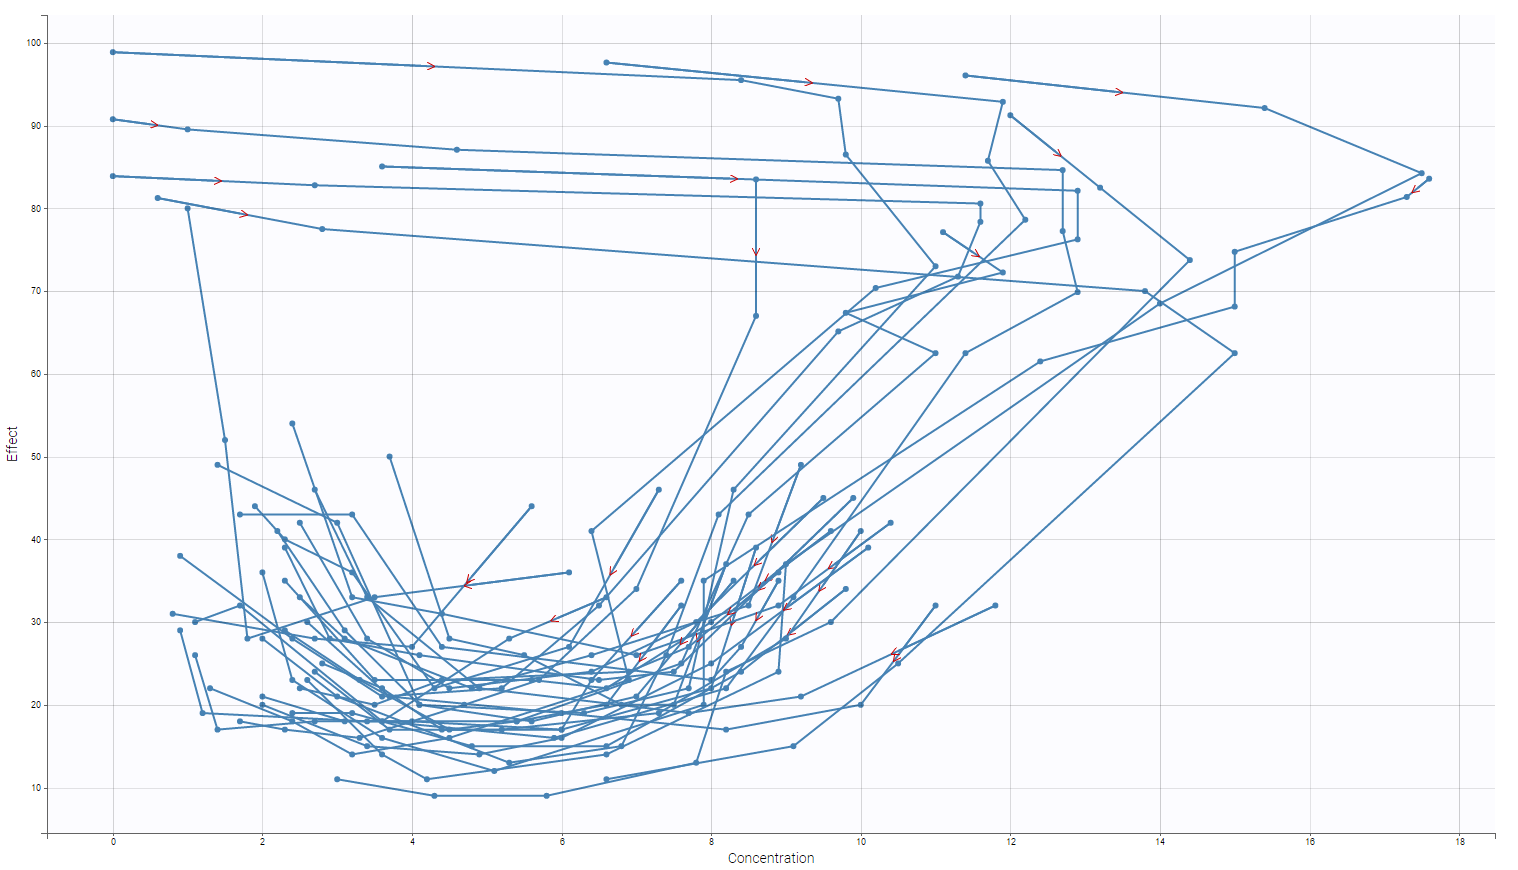
Then, the response does not seem to be direct. Notice that, as the observation times are no the same between the PK and the PD, interpolation is made to propose this kind of plot. One can also focus on one individual in particular as on the following figure
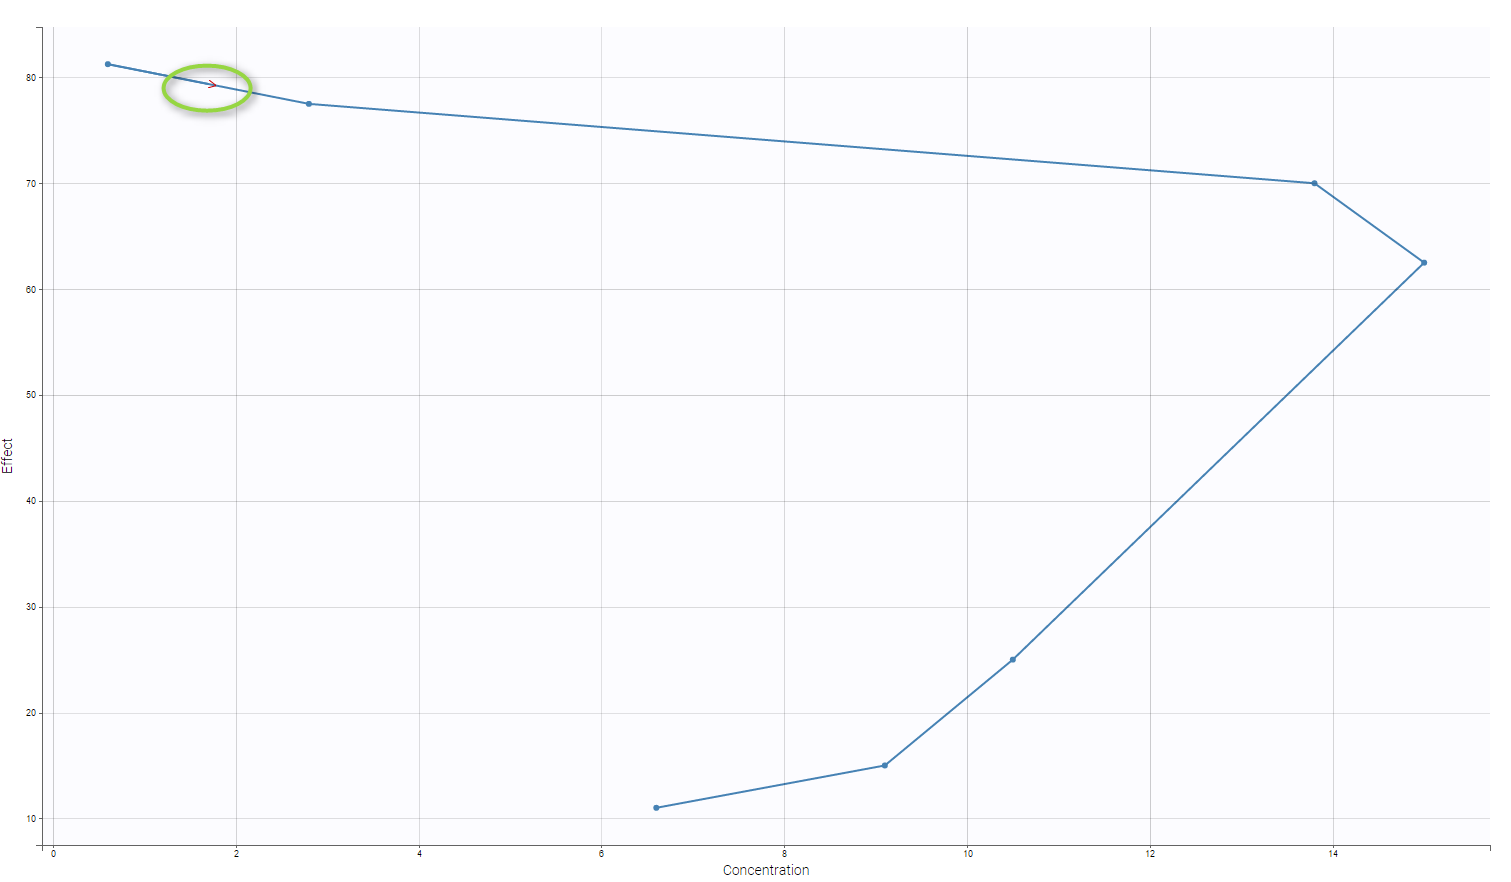
Notice that we also propose a red arrow to describe the evolution of time.