In this data set, 111 patients have been administrated a placebo or an active treatment. At randomization and at four visits during the treatment, their respiratory status was determined as being “poor” or “good”, which constitutes the categorical output. Covariates such as center, sex and age were also recorded. The goal was to evaluate the effect of the treatment on the respiratory status.
This data set has been originally published in:
Below we show a snapshot of the data set:
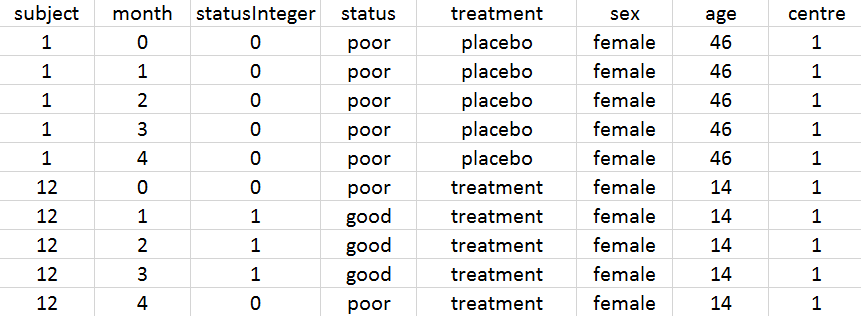
In MonolixSuite, the output categories must be coded as integers. Thus, we have created the column statusInteger where the respiratory status is coded as 0 for “poor” and 1 for “good”. For individual 1 on placebo, the respiratory status is poor at randomization and remains so during the 4 months. For individual 12 on treatment, the respiratory status is poor at randomization and improves to good during the first three months before deteriorating again to poor at month 4.
The definition of the columns is the following:
- subject: patient identifier, column-type ID.
- month: month after treatment start, column-type TIME
- statusInteger: respiratory status coded as integer, 0 for “poor” and 1 for “good”, column-type OBSERVATION.
- status: respiratory status coded as strings “poor” and “good”, column to be ignored
- treatment: type of treatment, active or placebo, column-type CATEGORICAL COVARIATE.
- sex: sex of the patient, female or name, column-type CATEGORICAL COVARIATE.
- age: age of the patient (in years), column-type CONTINUOUS COVARIATE.
- centre: index of the study center, 1 or 2, column-type CATEGORICAL COVARIATE.
The representation of statusInteger with respect to time is proposed on the following figure

Several points can be noticed:
- The categories must be coded as integers.
- There are respiratory status measures for each individual, the month column allows to define at which time the measures were done.
- ID and TIME column are mandatory. Thus, even when there is only one measurement per individual, an additional column with TIME should be added (full of 0 for example).
- Covariates must be constant within subjects (or subject-occasions when occasions are defined).
- In this example, two categories are present (“good” and “poor”), but any number of categories is possible.
When loading this data set into Datxplore, one can easily visualize the number of individuals with “poor” (coded as 0, in dark blue) or “good” (coded as 1, in light blue) respiratory status over time in the case of placebo (left) or active treatment (right):
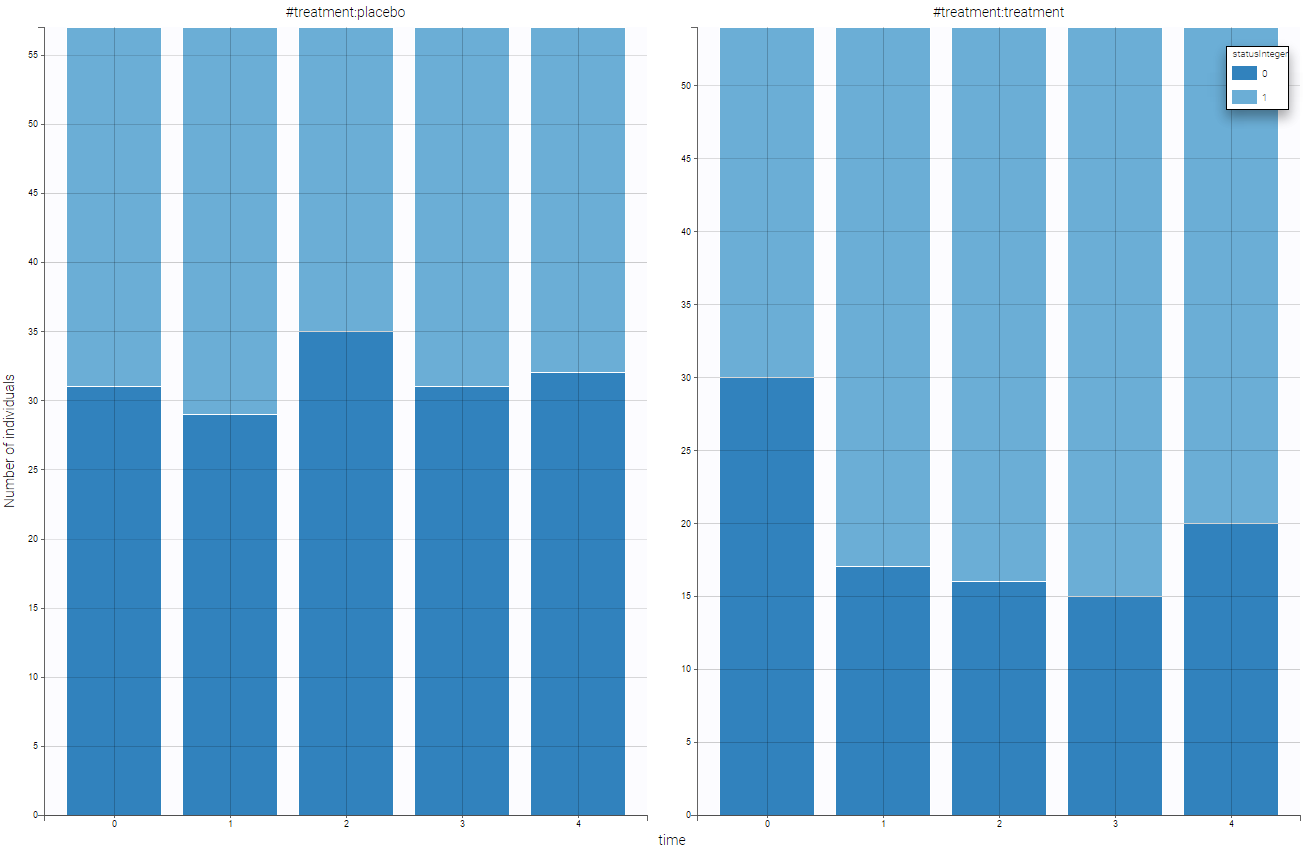
Based on this figure, it seems that the treatment is efficient a priori. We can additionally look at the other covariates and the impact on the output. One can split by sex as can be seen on the following figure.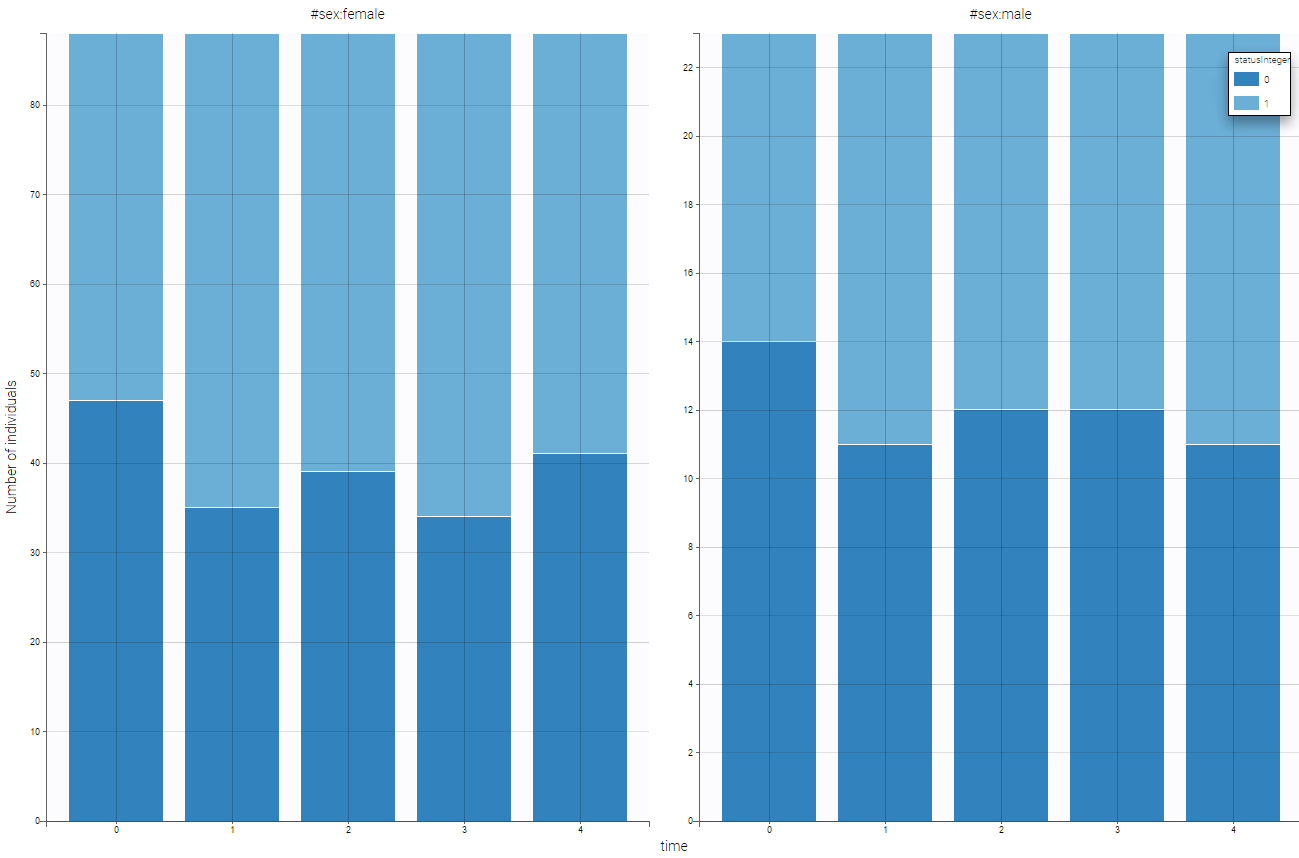
In that case, the sex covariate seems not to influence a lot the output.